


DBA of Champion Futures


Try a Futures Trading Platform FREE trading account. All of our demos come with real time streaming data feeds and charts. Individual, Corp. or Institutional accountwe have a Futures Trading Platform that will satisfy your trading needs.
1-516-515-3903

Multiple
Chart
Types
with
MultiCharts
MultiCharts offers the Futures and Commodity trader many different types of charts.
Chart Types
Professional technical analysis requires that you have professional tools at your disposal. MultiCharts has both regular and exotic chart types to meet your individual needs. Each chart type offers a different perspective on the market—so you can make informed decisions.
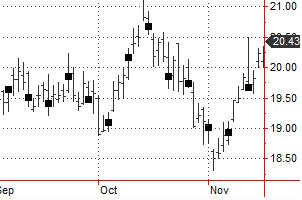
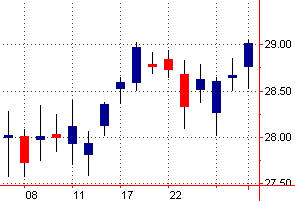
OHLC
This chart type is the most common way to display data for analysis. Open, high, low, and close prices are shown for the time increment represented by the bar. Bar charts can be time-based, tick-based, or volume-based.
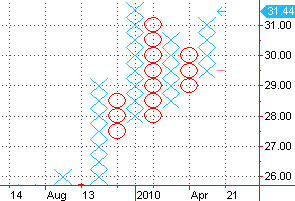
Point and Figure
This chart type only plots price movements, without taking time into consideration. A column of X’s is plotted as the price rises—and O’s as the price drops.
Candlesticks
This chart type uses the same price data as regular bar charts, with each candlestick representing the open, high, low, and close. The thick part, called the real body, represents the range between opening and closing prices. Long thin lines, shadows and wicks/tails, represent the range of price movement for the bar.
Renko
This chart type only plots price movements, without taking time or volume into consideration. It is constructed from ticks and looks like bricks stacked in adjacent columns. A new brick is drawn after the price passes the top or bottom of previously predefined amount.
Kagi
This chart type looks like a continuous line that changes directions and switches from thin to bold. The direction changes when the price changes beyond a predefined amount, and the line switches between thin and bold if the last change bypassed the last horizontal line.
3 Line break
This chart type only plots price movements, without taking time or volume into consideration. This chart type displays a series of vertical boxes that are based on price changes.
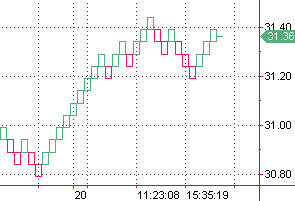
Hollow Candlesticks
Hollow candlesticks appear when the closing price is greater than the open, and filled candlesticks appear when the closing price is less than the open. This is the only difference from a regular candlestick chart.
Line on Close
This chart type connects the closing price for each bar with a line.
Symbol Chart
This chart type plots crosses at specified price values (indicators only).
Candlesticks with border
The only difference from a regular candlesticks chart is the borders around the body of the candle.
HLC
The only difference from an OHLC bar is that the opening price is not shown.
Invisible Bars
This functionality hides the chart from view, yet it can still be used for calculations. For example, if only indicator information is needed to be seen, you can hide the data series so you are not distracted.
Dots
This chart type plots a single dot at the closing price of each bar.
Histogram chart
This chart type plots vertical lines, which can be based on volume, price, and other factors.
Copyright © 2012 Futures Trading Platforms. All rights reserved
Past performance is not indicative of future results. The risk of loss in trading Futures and Options can be substantial. Futures and Options trading may not be suitable for everyone. Therefore, you should carefully consider the risks in light of your financial condition and trading objectives before deciding whether to trade. It is possible to lose more than the initial investment. The risks must be understood prior to trading.
MultiCharts offers different types of charts for the Futures and Commodities trader..
All rights for MultiCharts Trading Software are retained by MultiCharts, LLC
Futures Trading Platforms is a deep discount online Futures Trading Broker.