


DBA of Champion Futures


Try a Futures Trading Platform FREE trading account. All of our demos come with real time streaming data feeds and charts. Individual, Corp. or Institutional accountwe have a Futures Trading Platform that will satisfy your trading needs.
1-516-515-3903


Using
Drawing
Tools
with
MultiCharts
MultiCharts offers the Futures and Commodities trader many types of Drawing Tools
Trading Drawing Tools
|
A broad range of intelligent drawing tools is available. These tools allow you to focus on trends, support and resistance, gaps, pivots, triangles, and other price patterns. Trend Lines, Andrews' Pitchfork, Fibonacci Arcs, Gann Fans, and other studies can be easily drawn with a mouse click. |
Andrews' Pitchfork
This drawing tool helps predict the support and resistance areas in a trending market. It consists of three parallel lines—usually drawn from three consecutive major peaks or troughs.
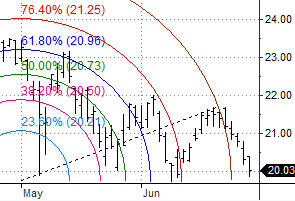
Fibonacci Speed/Resistance Arc
This analytical drawing tool determines the direction and speed of trend reversal, and it indicates support and resistance levels. You can draw up to 11 arcs based on any selected distance percentages as well as Fibonacci percentages.
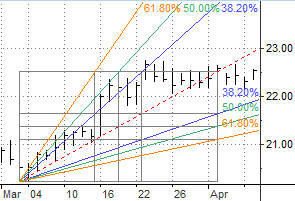
Fibonacci Speed/Resistance Fan
This analytical drawing tool indicates support and resistance levels of an existing trend and the price level at which possible changes in the trend may occur. You can draw up to 11 lines based on any selected distance percentages as well as Fibonacci percentages.
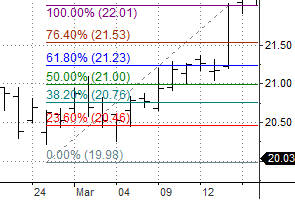
Fibonacci Retracement
This analytical drawing tool examines support and resistance levels, as well as price breakouts. It is represented by a series of horizontal lines that intersect the trend line (drawn between two extreme points) at the Fibonacci levels or selected distance percentages.
Fibonacci Trend-Based Time Lines
This analytical drawing tool predicts future price corrections and examines support and resistance levels, as well as price breakouts. It is represented by a series of vertical lines at date and time levels, which show probable price corrections in the existing trend.
Fibonacci Time Zones
This analytical drawing tool is represented by a series of vertical lines, and it indicates significant price movements near them. These vertical lines are spaced according to the Fibonacci number sequence (0, 1, 1, 2, 3, 5, 8, 13, 21, 34, 55, 89, …).
Gann Fan
This analytical drawing indicates time and price movements from important highs and lows, and it identifies price breakouts. Angled lines fan out from the selected point. They indicate a time-to-price relationship that may be relatively fast or relatively slow, depending on the size of the Gann angle.
Gann Square
The Gann Square is created by drawing a Gann Fan from each corner of a square.
Trend line
This analytical drawing tool indicates the direction of price movement
Extended Line
This analytical drawing tool indicates past and future directions of price movement. This is a trend line that extends left and right on the chart
Ray Line
This analytical drawing tool indicates possible future direction of price movement. This is a trend line that can only be extended to the right.
Regression Channel - Segment High-Low
This is a channel based on a regression line, which is calculated from open, high, low, and close values. The upper line is based on the highest value for the period and the lower line on the lowest value. The outer bounds outline the equidistant channel in which the market trades.
Regression Channel - Standard Deviation
This analytical drawing tool shows two parallel equidistant lines based on a specified number of standard deviations and is drawn above and below the regression line.
Arc
This is a non-analytical drawing tool that looks like an arched line, and it’s used for highlighting necessary chart segments. Arcs can be drawn at any angle.
Text
Text is a non-analytical drawing tool used to display user comments, and other text, directly on the chart.
Retracement Calculator
This tool computes the price retracement in percentages in order to anticipate future trading opportunities.
Ellipse
This is a non-analytical drawing tool for highlighting the necessary parts of a chart.
Rectangle
This is a non-analytical drawing tool for highlighting the necessary parts of a chart.
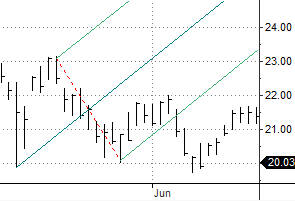
Extended Parallel Lines
This analytical drawing tool draws parallel trend lines that are extended to the left and right on the chart. They outline the equidistant channel in which the market trades. The upper horizontal line is the resistance line. The lower horizontal line is the support line. If either of these lines is penetrated, a price breakout may occur.
Ray Parallel Lines
This analytical drawing tool draws parallel trend lines that are extended to the right only. They outline the equidistant channel in which the market trades.
Parallel Lines
This is a pair of parallel lines that outline the equidistant channel in which the market trades.
Horizontal Parallel Lines
This is a pair of horizontal parallel lines that outline the equidistant channel in which the market trades.
Horizontal Line
This analytical drawing tool indicates a particular price level. You can draw more than one in order to mark support and resistance levels.
Regression Channel - Raff Regression
Gilbert Raff developed this analytical drawing tool, and it precisely defines a price trend and its support and resistance levels. It is represented by two parallel equidistant lines drawn above and below the linear regression line, and it is based on the maximum upward and downward oscillation.
Regression Channel - Standard Error
This analytical drawing tool shows two parallel equidistant lines based on a specified number of standard errors and drawn above and below the regression line.
Additional Drawing Tools with MultiCharts
Futures Trading Platforms is a deep discount online Futures Trading Broker.
All rights for MultiCharts Trading Software are retained by MultiCharts, LLC
Using Drawing Tools with MultiCharts
Past performance is not indicative of future results. The risk of loss in trading Futures and Options can be substantial. Futures and Options trading may not be suitable for everyone. Therefore, you should carefully consider the risks in light of your financial condition and trading objectives before deciding whether to trade. It is possible to lose more than the initial investment. The risks must be understood prior to trading.
opyright © 2012 Futures Trading Platforms. All rights reserved
Need help with MultiCharts Drawing Tools? Just ask one of our Futures Trading Brokers.